
📊 The Terminal
SWARM in the browser — charts, the live tape, holders and one-tap buying, with caller data layered on top.
What you get
Pulse — watching launches happen
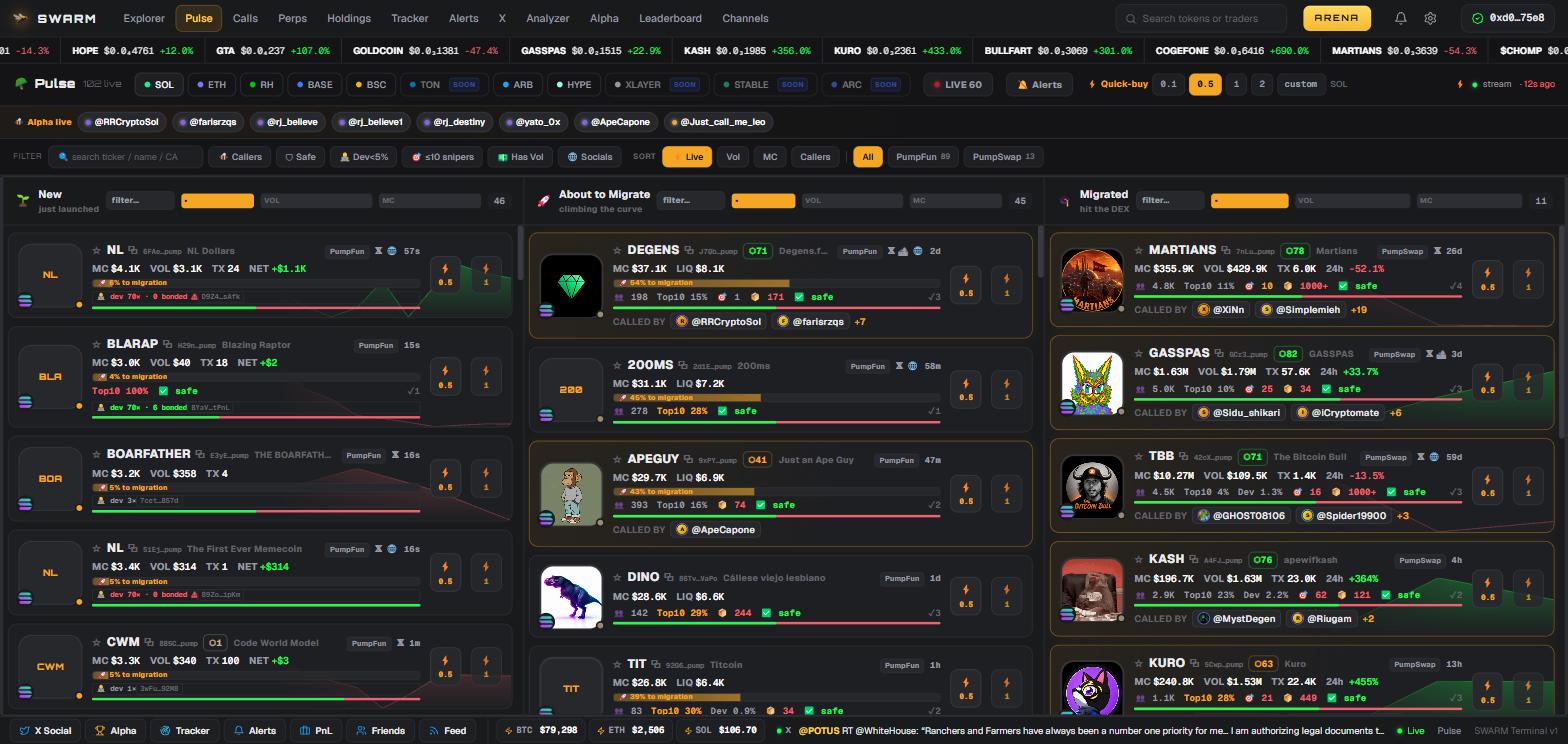
Three live columns following a token through its life: New just launched, About to Migrateclimbing the bonding curve with a progress bar, and Migrated once it hits a DEX.
Each card carries market cap, volume, transactions, holders, dev holding, top-10 share and a safety mark — plus the CALLED BY row with the ranked callers who called it. Filter with Callers, Safe, Dev<5%, ≤10 snipers,Has Vol and Socials. Set ⚡ Quick-buy and the lightning button on any card buys instantly.
Explorer — the screener
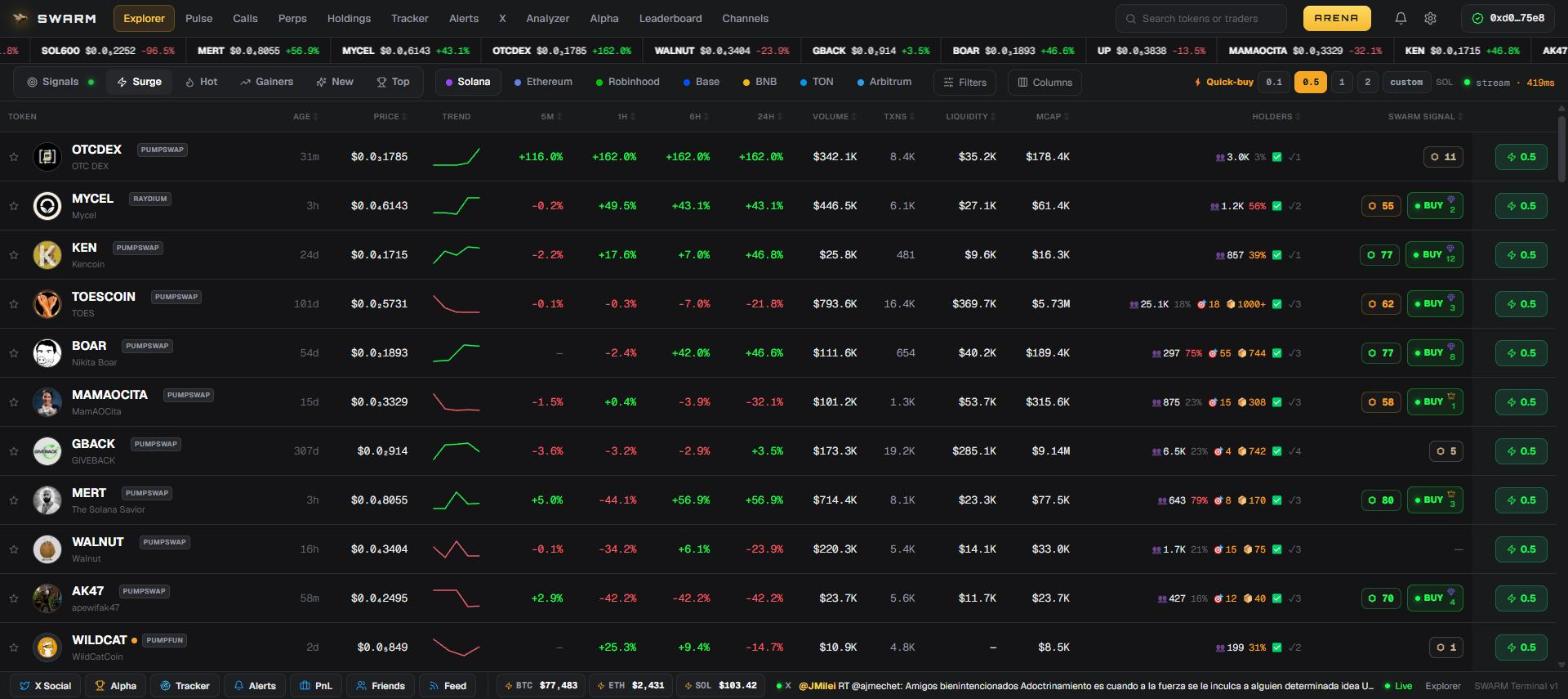
SurgeFreshest movement, weighted to the last five minutes with illiquid tokens sunk. The default view.SignalsOnly what SWARM would flag as BUY or WATCH. A green dot appears on the tab when it has something.HotBy 24h volume.GainersBy 24h change.NewBy age.TopBy market cap.Every metric column sorts on tap. Filters holds the full set including the SWARM-native ones — minimum SwarmScore, caller tier and number of callers. Columns hides what you do not use.
The token page
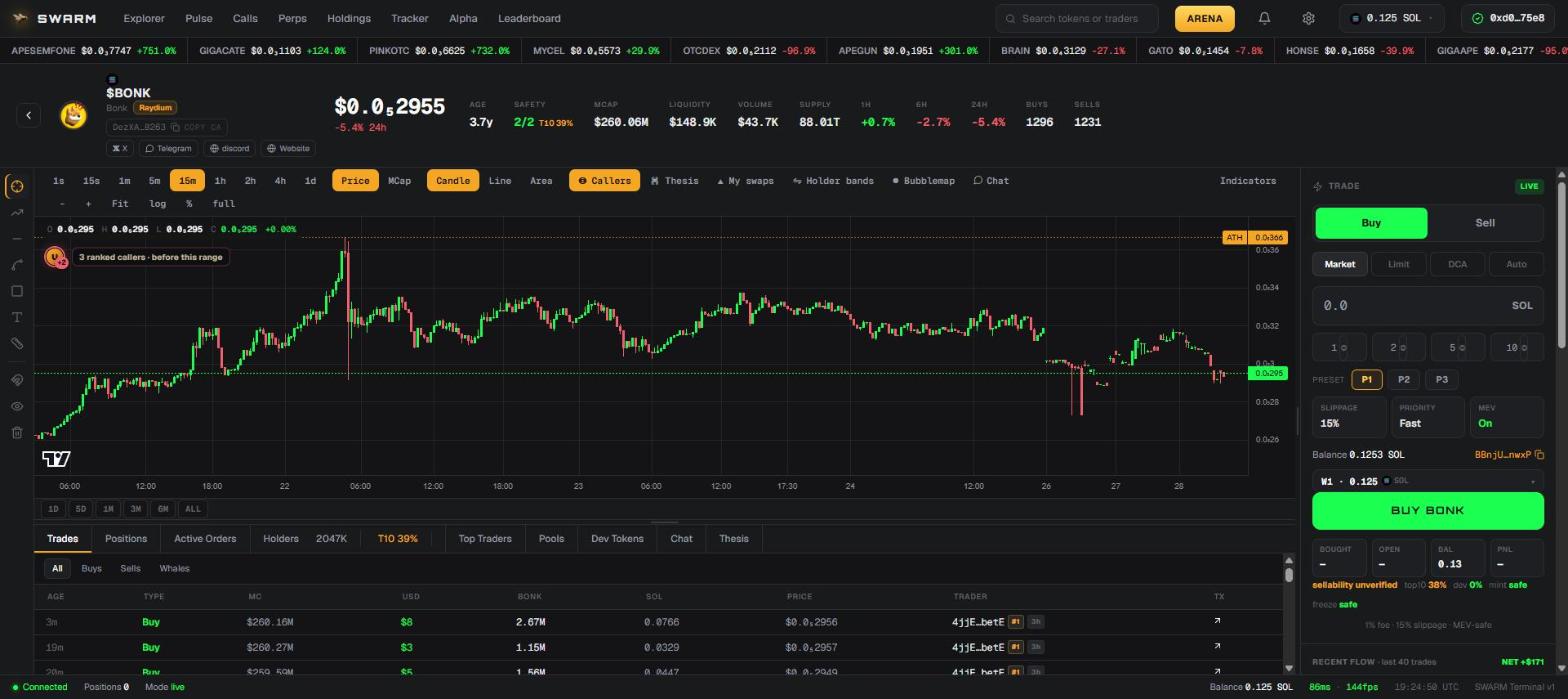
The chart
- Timeframes
1sto1d— second-level is real, not smoothed. Price/MCap— on a memecoin, market cap is usually what you mean.◎ Callersplots ranked callers on the price line.▲ My swapsplots your own trades.⇋ Holder bandsshades where holders sit;Bubblemapshows wallet clusters.
The trade panel
Buy/SellwithMarket,Limit,DCAandAuto.- Amount presets plus
P1P2P3profiles. - Slippage, priority and MEV shown as live values rather than buried in settings.
- Safety row underneath: sellability, top-10, dev, mint and freeze authority.
The data tabs
TradesThe live tape, with the market cap each trade happened at. Filter to Buys, Sells or Whales.Top TradersPer wallet: bought, entry market cap, sold, exit market cap, realised PnL, hold time, remaining and who funded them.HoldersFull holder list with top-10 concentration.PositionsYour open positions, live.Active OrdersYour pending limits, take-profits and stop-losses.PoolsEvery liquidity venue for the token.Dev TokensWhat else the deployer has launched — usually the fastest read on intent.ThesisWritten reasoning attached to the token.